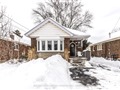
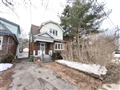
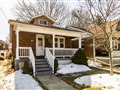
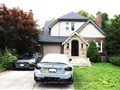
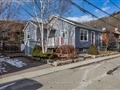
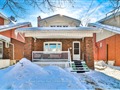
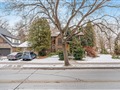
111 South Oval
$851,410
Comparative Market Analysis
Jun 28, 2025
NOT AN ACTIVE LISTING
Historical Performance
| Period | $ Change | % Change |
| 1 Day | +$299 | +0.035% |
| 7 Days | +$346 | +0.041% |
| 30 Days | -$1,123 | -0.132% |
| 3 Months | -$2,133 | -0.250% |
| 6 Months | +$14.1k | +1.69% |
| 1 Year | -$36.7k | -4.13% |
| 3 Years | +$144k | +20.3% |
| 5 Years | +$232k | +37.5% |
| 10 Years | +$454k | +114% |
List My Property
Real Estate Statistics
Financing Solutions
Browsing History
147 Aquasanta Cres, Hamilton
5 seconds ago
AS SEEN ON


Are You a Licensed Real Estate Agent or Broker?