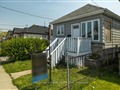
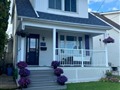
93 Albany Ave
$617,365
Comparative Market Analysis
Jun 1, 2025
NOT AN ACTIVE LISTING
Historical Performance
| Period | $ Change | % Change |
| 1 Day | +$228 | +0.037% |
| 7 Days | +$238 | +0.039% |
| 30 Days | -$990 | -0.160% |
| 3 Months | -$2,370 | -0.382% |
| 6 Months | +$8,168 | +1.34% |
| 1 Year | -$32.0k | -4.93% |
| 3 Years | +$95.6k | +18.3% |
| 5 Years | +$213k | +52.6% |
| 10 Years | +$435k | +239% |
List My Property
Real Estate Statistics
Financing Solutions
Browsing History
173 Tragina Ave, Hamilton
2 seconds ago
1396 Upper Ottawa St 16, Hamilton
3 seconds ago
520 Cochrane Rd, Hamilton
4 seconds ago
35 Britannia Ave, Hamilton
5 seconds ago
170 Britannia Ave, Hamilton
6 seconds ago
1396 Upper Ottawa St 7, Hamilton
7 seconds ago
125 Shoreview Pl 510, Hamilton
8 seconds ago
AS SEEN ON


Are You a Licensed Real Estate Agent or Broker?