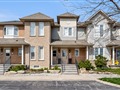
800 Paramount Dr 42
$645,914
Comparative Market Analysis
Apr 29, 2024
NOT AN ACTIVE LISTING
Historical Performance
| Period | $ Change | % Change |
| 1 Day | +$255 | +0.040% |
| 7 Days | +$530 | +0.082% |
| 30 Days | -$19 | -0.003% |
| 3 Months | +$117 | +0.018% |
| 6 Months | +$12.5k | +1.98% |
| 1 Year | -$22.4k | -3.36% |
| 3 Years | +$131k | +25.5% |
| 5 Years | +$214k | +49.5% |
| 10 Years | +$370k | +134% |
List My Property
Real Estate Statistics
Financing Solutions
AS SEEN ON


Are You a Licensed Real Estate Agent or Broker?