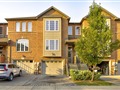
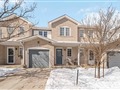
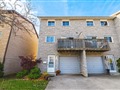
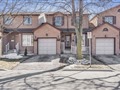
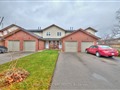
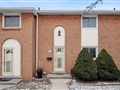
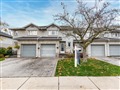
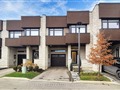
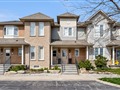
800 Paramount Dr 40
$674,953
Comparative Market Analysis
Jun 1, 2025
NOT AN ACTIVE LISTING
Historical Performance
| Period | $ Change | % Change |
| 1 Day | +$267 | +0.040% |
| 7 Days | +$534 | +0.079% |
| 30 Days | -$123 | -0.018% |
| 3 Months | -$276 | -0.041% |
| 6 Months | +$12.1k | +1.82% |
| 1 Year | -$26.6k | -3.79% |
| 3 Years | +$127k | +23.2% |
| 5 Years | +$226k | +50.4% |
| 10 Years | +$398k | +144% |
List My Property
Real Estate Statistics
Financing Solutions
Browsing History
1 second ago
101 Shoreview Pl 605, Hamilton
2 seconds ago
115 Shoreview Pl 9, Hamilton
3 seconds ago
40 Albany Ave, Hamilton
4 seconds ago
752 Beach Blvd, Hamilton
5 seconds ago
329 Paling Ave, Hamilton
6 seconds ago
125 Shoreview Pl 226, Hamilton
7 seconds ago
161 Skinner Rd, Hamilton
8 seconds ago
269 Britannia Ave, Hamilton
9 seconds ago
AS SEEN ON


Are You a Licensed Real Estate Agent or Broker?