64 Hildegard Dr
$1,545,860
Comparative Market Analysis
Feb 22, 2025
NOT AN ACTIVE LISTING
Historical Performance
| Period | $ Change | % Change |
| 1 Day | +$525 | +0.034% |
| 7 Days | +$447 | +0.029% |
| 30 Days | -$2,773 | -0.179% |
| 3 Months | -$6,139 | -0.396% |
| 6 Months | +$20.7k | +1.36% |
| 1 Year | -$80.6k | -4.95% |
| 3 Years | +$307k | +24.8% |
| 5 Years | +$639k | +70.4% |
| 10 Years | +$1.15m | +289% |
List My Property
Real Estate Statistics
Financing Solutions
Browsing History
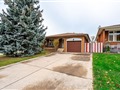
64 Hildegard Dr, Hamilton
0 second ago
574 Claymeadow Ave, Mississauga
5 seconds ago
AS SEEN ON

Are You a Licensed Real Estate Agent or Broker?