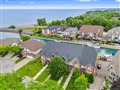
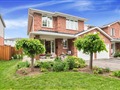
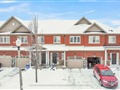
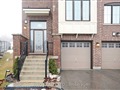
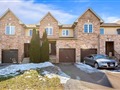
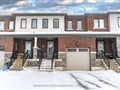
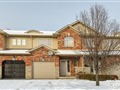
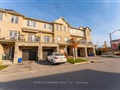
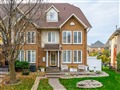
63 Edenrock Dr
$941,608
Comparative Market Analysis
Jun 7, 2025
NOT AN ACTIVE LISTING
Historical Performance
| Period | $ Change | % Change |
| 1 Day | +$443 | +0.047% |
| 7 Days | +$1,506 | +0.160% |
| 30 Days | +$2,165 | +0.231% |
| 3 Months | +$8,566 | +0.918% |
| 6 Months | +$42.0k | +4.66% |
| 1 Year | +$34.1k | +3.76% |
| 3 Years | +$293k | +45.1% |
| 5 Years | +$381k | +68.1% |
| 10 Years | +$579k | +160% |
List My Property
Real Estate Statistics
Financing Solutions
Browsing History
1121 Queensdale Ave, Hamilton
5 seconds ago
AS SEEN ON


Are You a Licensed Real Estate Agent or Broker?