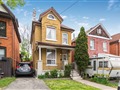
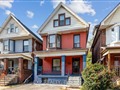
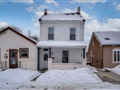
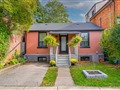
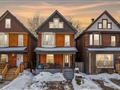
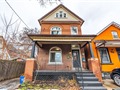
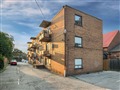
61 Leeming St
$565,516
Comparative Market Analysis
Jun 17, 2025
NOT AN ACTIVE LISTING
Historical Performance
| Period | $ Change | % Change |
| 1 Day | +$208 | +0.037% |
| 7 Days | +$331 | +0.059% |
| 30 Days | -$339 | -0.060% |
| 3 Months | -$254 | -0.045% |
| 6 Months | +$11.6k | +2.10% |
| 1 Year | -$19.0k | -3.24% |
| 3 Years | +$123k | +27.9% |
| 5 Years | +$207k | +57.7% |
| 10 Years | +$345k | +156% |
List My Property
Real Estate Statistics
Financing Solutions
AS SEEN ON


Are You a Licensed Real Estate Agent or Broker?