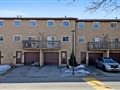
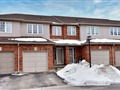
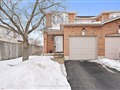
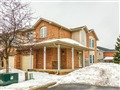
39 Pinewoods Dr 8
$562,748
Comparative Market Analysis
Jun 1, 2025
NOT AN ACTIVE LISTING
Historical Performance
| Period | $ Change | % Change |
| 1 Day | +$223 | +0.040% |
| 7 Days | +$374 | +0.066% |
| 30 Days | -$451 | -0.080% |
| 3 Months | -$1,366 | -0.242% |
| 6 Months | +$7,708 | +1.39% |
| 1 Year | -$27.8k | -4.70% |
| 3 Years | +$79.7k | +16.5% |
| 5 Years | +$156k | +38.3% |
| 10 Years | +$305k | +119% |
List My Property
Real Estate Statistics
Financing Solutions
Browsing History
1 second ago
AS SEEN ON


Are You a Licensed Real Estate Agent or Broker?