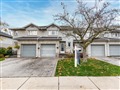
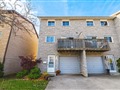
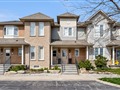
39 Pinewoods Dr 23
$465,789
Comparative Market Analysis
Jun 1, 2025
NOT AN ACTIVE LISTING
Historical Performance
| Period | $ Change | % Change |
| 1 Day | +$184 | +0.040% |
| 7 Days | +$334 | +0.072% |
| 30 Days | -$253 | -0.054% |
| 3 Months | -$749 | -0.161% |
| 6 Months | +$7,136 | +1.56% |
| 1 Year | -$21.2k | -4.36% |
| 3 Years | +$77.2k | +19.9% |
| 5 Years | +$139k | +42.7% |
| 10 Years | +$263k | +130% |
List My Property
Real Estate Statistics
Financing Solutions
AS SEEN ON


Are You a Licensed Real Estate Agent or Broker?