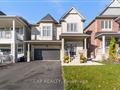
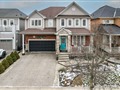
33 Viking Dr
$593,674
Comparative Market Analysis
Jun 28, 2025
NOT AN ACTIVE LISTING
Historical Performance
| Period | $ Change | % Change |
| 1 Day | +$199 | +0.033% |
| 7 Days | +$220 | +0.037% |
| 30 Days | -$799 | -0.134% |
| 3 Months | -$1,444 | -0.243% |
| 6 Months | +$9,898 | +1.70% |
| 1 Year | -$26.5k | -4.27% |
| 3 Years | +$106k | +21.8% |
| 5 Years | +$192k | +47.8% |
| 10 Years | +$358k | +152% |
List My Property
Real Estate Statistics
Financing Solutions
AS SEEN ON


Are You a Licensed Real Estate Agent or Broker?