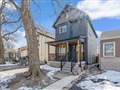
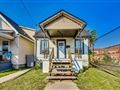
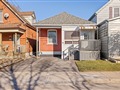
33 Albany Ave
$620,635
Comparative Market Analysis
Jun 22, 2025
NOT AN ACTIVE LISTING
Historical Performance
| Period | $ Change | % Change |
| 1 Day | +$229 | +0.037% |
| 7 Days | +$545 | +0.088% |
| 30 Days | +$553 | +0.089% |
| 3 Months | +$3,128 | +0.506% |
| 6 Months | +$21.1k | +3.52% |
| 1 Year | +$2,954 | +0.478% |
| 3 Years | +$166k | +36.6% |
| 5 Years | +$231k | +59.4% |
| 10 Years | +$379k | +157% |
List My Property
Real Estate Statistics
Financing Solutions
AS SEEN ON


Are You a Licensed Real Estate Agent or Broker?