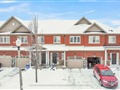
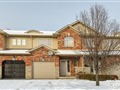
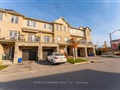
30 Times Square Blvd 32
$884,015
Comparative Market Analysis
Jun 1, 2025
NOT AN ACTIVE LISTING
Historical Performance
| Period | $ Change | % Change |
| 1 Day | +$416 | +0.047% |
| 7 Days | +$1,029 | +0.116% |
| 30 Days | +$30 | +0.003% |
| 3 Months | +$534 | +0.060% |
| 6 Months | +$20.9k | +2.42% |
| 1 Year | -$20.1k | -2.23% |
| 3 Years | +$215k | +32.0% |
| 5 Years | +$316k | +55.7% |
| 10 Years | +$517k | +141% |
List My Property
Real Estate Statistics
Financing Solutions
Browsing History
47 Weir Rd, Hamilton
1 second ago
Heath St, Hamilton
2 seconds ago
30 Times Square Blvd 236, Hamilton
3 seconds ago
129 Weir Rd, Hamilton
4 seconds ago
503 Highway 8 Rd 44, Hamilton
5 seconds ago
Old #8 Hllw, Hamilton
6 seconds ago
122 Weir Rd, Hamilton
7 seconds ago
AS SEEN ON

Are You a Licensed Real Estate Agent or Broker?