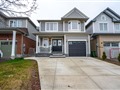
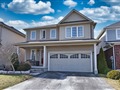
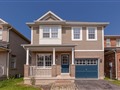
263 Voyager Pass
$1,022,118
Comparative Market Analysis
May 5, 2024
NOT AN ACTIVE LISTING
Historical Performance
| Period | $ Change | % Change |
| 1 Day | +$342 | +0.033% |
| 7 Days | +$870 | +0.085% |
| 30 Days | +$1,421 | +0.139% |
| 3 Months | +$10.0k | +0.990% |
| 6 Months | +$49.6k | +5.10% |
| 1 Year | +$8,916 | +0.880% |
| 3 Years | +$207k | +25.5% |
| 5 Years | +$329k | +47.5% |
| 10 Years | +$590k | +136% |
List My Property
Real Estate Statistics
Financing Solutions
AS SEEN ON


Are You a Licensed Real Estate Agent or Broker?