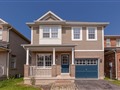
194 Voyager Pass
$920,078
Comparative Market Analysis
May 5, 2024
NOT AN ACTIVE LISTING
Historical Performance
| Period | $ Change | % Change |
| 1 Day | +$308 | +0.033% |
| 7 Days | +$402 | +0.044% |
| 30 Days | -$935 | -0.101% |
| 3 Months | -$1,194 | -0.130% |
| 6 Months | +$17.7k | +1.96% |
| 1 Year | -$34.9k | -3.66% |
| 3 Years | +$188k | +25.8% |
| 5 Years | +$327k | +55.2% |
| 10 Years | +$554k | +152% |
List My Property
Real Estate Statistics
Financing Solutions
AS SEEN ON


Are You a Licensed Real Estate Agent or Broker?