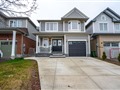
165 Voyager Pass
$946,623
Comparative Market Analysis
May 5, 2024
NOT AN ACTIVE LISTING
Historical Performance
| Period | $ Change | % Change |
| 1 Day | +$317 | +0.033% |
| 7 Days | +$384 | +0.041% |
| 30 Days | -$1,106 | -0.117% |
| 3 Months | -$1,715 | -0.181% |
| 6 Months | +$17.1k | +1.84% |
| 1 Year | -$38.6k | -3.92% |
| 3 Years | +$184k | +24.2% |
| 5 Years | +$324k | +52.1% |
| 10 Years | +$564k | +147% |
List My Property
Real Estate Statistics
Financing Solutions
AS SEEN ON


Are You a Licensed Real Estate Agent or Broker?