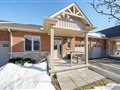
130 Southbrook Dr 36
$691,530
Comparative Market Analysis
May 13, 2025
NOT AN ACTIVE LISTING
Historical Performance
| Period | $ Change | % Change |
| 1 Day | +$273 | +0.039% |
| 7 Days | +$496 | +0.072% |
| 30 Days | -$361 | -0.052% |
| 3 Months | -$909 | -0.131% |
| 6 Months | +$11.7k | +1.72% |
| 1 Year | -$28.2k | -3.91% |
| 3 Years | +$107k | +18.3% |
| 5 Years | +$186k | +36.9% |
| 10 Years | +$378k | +121% |
List My Property
Real Estate Statistics
Financing Solutions
Browsing History
South Townline Rd, Hamilton
2 seconds ago
AS SEEN ON

Are You a Licensed Real Estate Agent or Broker?