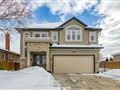
12 Sophia Dr
$1,052,458
Comparative Market Analysis
Jun 6, 2025
NOT AN ACTIVE LISTING
Historical Performance
| Period | $ Change | % Change |
| 1 Day | +$361 | +0.034% |
| 7 Days | +$315 | +0.030% |
| 30 Days | -$1,866 | -0.177% |
| 3 Months | -$4,165 | -0.394% |
| 6 Months | +$14.1k | +1.36% |
| 1 Year | -$54.8k | -4.95% |
| 3 Years | +$149k | +16.4% |
| 5 Years | +$279k | +36.1% |
| 10 Years | +$565k | +116% |
List My Property
Real Estate Statistics
Financing Solutions
Browsing History
129 Cactus Cres, Hamilton
1 second ago
38 Geranium Ave, Hamilton
1 second ago
46 Seabreeze Cres, Hamilton
2 seconds ago
27 Gerald Cres, Hamilton
2 seconds ago
11 Stockbridge Gdns, Hamilton
3 seconds ago
31 Russet Crt, Hamilton
3 seconds ago
74 Pagebrook Cres, Hamilton
4 seconds ago
424 Upper Sherman Ave, Hamilton
4 seconds ago
10 Jones St, Hamilton
5 seconds ago
40 Tossell Ave, Hamilton
5 seconds ago
AS SEEN ON


Are You a Licensed Real Estate Agent or Broker?