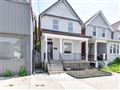
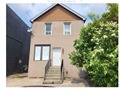
116 Birmingham St
$604,916
Comparative Market Analysis
Jun 7, 2025
NOT AN ACTIVE LISTING
Historical Performance
| Period | $ Change | % Change |
| 1 Day | +$221 | +0.036% |
| 7 Days | +$225 | +0.037% |
| 30 Days | -$986 | -0.163% |
| 3 Months | -$2,333 | -0.384% |
| 6 Months | +$8,017 | +1.34% |
| 1 Year | -$31.4k | -4.93% |
| 3 Years | +$95.0k | +18.6% |
| 5 Years | +$245k | +68.1% |
| 10 Years | +$440k | +266% |
List My Property
Real Estate Statistics
Financing Solutions
Browsing History
65 Cambridge Ave, Hamilton
2 seconds ago
85 Robins Ave, Hamilton
3 seconds ago
26 Fraser Ave, Hamilton
5 seconds ago
16 Benvenuto Cres, Hamilton
6 seconds ago
5 East 36th St 412, Hamilton
7 seconds ago
12 Halo Crt, Hamilton
8 seconds ago
54 Robins Ave, Hamilton
9 seconds ago
AS SEEN ON


Are You a Licensed Real Estate Agent or Broker?