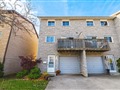
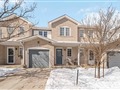
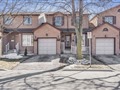
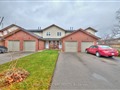
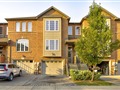
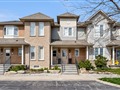
1155 Paramount Dr 55
$639,411
Comparative Market Analysis
Jun 1, 2025
NOT AN ACTIVE LISTING
Historical Performance
| Period | $ Change | % Change |
| 1 Day | +$253 | +0.040% |
| 7 Days | +$619 | +0.097% |
| 30 Days | +$509 | +0.080% |
| 3 Months | +$2,377 | +0.373% |
| 6 Months | +$18.6k | +3.00% |
| 1 Year | -$5,875 | -0.910% |
| 3 Years | +$126k | +24.5% |
| 5 Years | +$201k | +46.0% |
| 10 Years | +$359k | +128% |
List My Property
Real Estate Statistics
Financing Solutions
Browsing History
101 Shoreview Pl 326, Hamilton
2 seconds ago
175 Summerhill Ave, Hamilton
3 seconds ago
125 Shoreview Pl 519, Hamilton
4 seconds ago
211 Glencairn Ave, Hamilton
5 seconds ago
125 Shoreview Pl 206, Hamilton
6 seconds ago
135 Bell Ave, Hamilton
8 seconds ago
125 Shoreview Pl 304, Hamilton
9 seconds ago
125 Shoreview Pl 222, Hamilton
10 seconds ago
125 Shoreview Pl 435, Hamilton
11 seconds ago
10 Adair Ave, Hamilton
12 seconds ago
AS SEEN ON


Are You a Licensed Real Estate Agent or Broker?