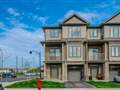
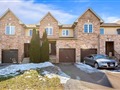
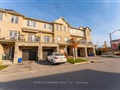
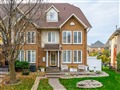
11 Stockbridge Gdns 9
$585,003
Comparative Market Analysis
Jun 7, 2025
NOT AN ACTIVE LISTING
Historical Performance
| Period | $ Change | % Change |
| 1 Day | +$275 | +0.047% |
| 7 Days | +$596 | +0.102% |
| 30 Days | -$407 | -0.070% |
| 3 Months | -$1,153 | -0.197% |
| 6 Months | +$10.4k | +1.80% |
| 1 Year | -$22.8k | -3.74% |
| 3 Years | +$114k | +24.1% |
| 5 Years | +$193k | +49.2% |
| 10 Years | +$332k | +131% |
List My Property
Real Estate Statistics
Financing Solutions
Browsing History
112 Oneida Blvd, Hamilton
6 seconds ago
36 Alanson St, Hamilton
11 seconds ago
4135 Glancaster Rd, Hamilton
21 seconds ago
AS SEEN ON


Are You a Licensed Real Estate Agent or Broker?